In February 2018, Malaysia’s Minister of International Trade and Industry indicated that eCommerce accounted for 6.1% of the country’s GDP in 2016. When calculated, eCommerce has contributed approximately RM74.6 billion (US $19 billion) to Malaysia’s GDP almost two years ago and this figure is expected to see exponential growth in the following years.
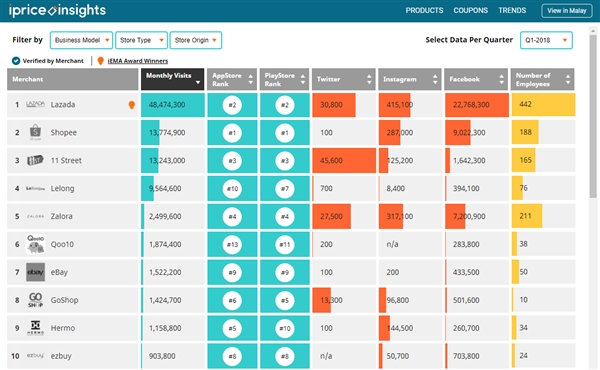
To keep track of the fast-paced digital economy, iPrice Group released its latest figures in the Map of eCommerce. The infographic analyzes Malaysia’s top 50 eCommerce based on web traffic, mobile app rankings (both iOS Store and Google Play), social media followers (Facebook, Instagram and Twitter), and number of employees (LinkedIn).
Here’s iPrice key findings with the updated data.
- Lazada maintains its market lead on desktop
In Q1 2018, Lazada maintained its lead with an average online traffic of 48.4 million followed by Shopee in second with 13.7 million and 11street at 13.2 million. In a span of four quarters, Lazada’s average monthly traffic grew 25.3% from 38.6 million to 48.4 million. Within the same period, we also saw a rise in number of employees from 361 to 442 according to LinkedIn.
In Q1 2018 Lazada were prominent in the headlines as they saw an increased commitment from Alibaba. The Chinese eCommerce giant pumped in an additional US $2 billion investment into Lazada, which now totals at US $4 billion from a $2 billion infusion over the past two years. This probably spurred Lazada’s growth in Q1 and is expected to maintain its lead for the rest of 2018.
- Shopee overtakes 11street as the second most visited eCommerce site
For the first time, Shopee displaced 11street as the 2nd most visited eCommerce site with an average traffic of 13.7 million for Q1 2018. In less than a year, Shopee experienced 302.9% growth, appearing at 5th place in the Map of eCommerce in Q2 2017 with 3.4 million average visitors and now 2nd place with 13.7 million average visitors as of Q1 2018.
Shopee’s rapid rise now means that the SEA (formerly known as Garena) owned eCommerce site is Lazada’s closest competitor on desktop. However, on the mobile platform, Shopee has been leading as the highest ranked shopping app since December 2017. Following them in mobile ranking is Lazada, 11street, and Zalora.
Each eCommerce mobile shopping app in the Map of eCommerce was ranked based on its average rank recorded on both iOS Store and Google Play Store.
- Q4 is the most vital period for online stores
As of Q1 2018, iPrice Group has been ranking Malaysia’s top eCommerce for four consecutive quarters. When comparing online traffic, we noted that Q4 (October, November and December 2017) was the most important month for eCommerce.
In Q4, online traffic was the highest and this was no surprise as most major online sale periods took place in the last three months of 2017. Among the most significant sale period was the MYCyberSale, 11.11 Sale (Singles Day), 12.12 Sale and the year-end sale.
- eCommerce in Malaysia has provided more than 1,600 jobs
With LinkedIn, we found that Malaysia’s top 50 eCommerce has provided more than 1,600 jobs in the country. The actual figures might be significantly higher as not all currently in the eCommerce sector might have an updated or active LinkedIn account.
- Malaysia’s top three ecommerce remains consistent
Looking specifically at Malaysian-based eCommerce, Lelong, Hermo, and GoShop consistently ranks as Malaysia’s top three platforms for Q1 2018. On average, Lelong has about 9.5 million visitors while GoShop has 1.4 million, and Hermo has 1.1 million visitors. Lelong remains as the oldest eCommerce site in the list as it was founded in 1998 by Kwok Wei and Richard Tan through Interbase Resources Sdn Bhd.
Check out the full infographic for more insights: https://iprice.my/insights/mapofecommerce/en/

Methodology
- The Map of E-Commerce ranks Malaysia’s top 50 e-commerce players based on their average quarterly traffic, mobile application ranking, social media followers and number of staff. Data was collected in April 2018
- Monthly Visits – Average monthly website visits. Source: SimilarWeb
- App Ranking – Average ranking of mobile app. Source: App Annie
- Social Media Followers – Source: Facebook, Twitter & Instagram
- Number of Employees – Source: LinkedIn. Data will be displayed as (n/a) if the number of employees is not available
- List of Merchants – E-commerce who received more than 100,000 visitors per-month or 100,000 social media followers are qualified for this list
- The following industries were not included in this list: e-ticketing, financial services, rental services, insurance, delivery service, food & beverage, meta-search, couponing, cashback websites and ecommerce who solely provides classified ads/P2P services
- All e-commerce who initiated their business as a physical store were excluded from this list
